Population Density Data
Gain actionable insights with predictive population density estimations tailored to your specific area and timeframe.
Available in 

Unlock predictive population density insights for enhanced decision-making
Imagine providing developers with predictive population density estimates for precise geographic areas, enabling faster, data-driven decisions.
By leveraging historical anonymized data from network-connected devices, the Population Density Data API delivers accurate insights that can sharpen urban planning, marketing strategy, and resource allocation.
Data is aggregated through Flux Vision, Orange’s solution for analyzing population movement. Flux Vision counts and aggregates mobile devices based on observed properties and behaviors, using signaling events exchanged with the cellular network. A weighting mechanism ensures the statistics reflect the broader population, not just Orange subscribers. The underlying algorithms are designed to protect privacy by removing personal data, supporting irreversible anonymization. These proprietary methods are developed with rigorous research and align with CNIL and GDPR recommendations.
Expand your reach across France
The Population Density Data API now delivers complete coverage for France including Corsica. Make smarter decisions with data that goes further.
💡 Wondering about the cost? Use our calculator to get a tailored estimate in just a few clicks.
Benefits

Enhanced Decision-Making
Provides accurate, real-time population density data for informed decision-making across various sectors, leading to effective planning and resource allocation.

Improved Public Safety
Offers insights into population density for better public safety management, including crowd control, emergency response planning, and risk assessment.

Cost Efficiency
Helps optimize resource allocation, reducing unnecessary expenditures by allocating resources based on actual needs.

Regulatory Compliance
Ensures adherence to regulatory requirements, especially for drone operations, by providing accurate population density data for safer flight routes and improved approval processes.
Use cases
Urban Planning and Infrastructure Development
City planners analyze population distribution patterns to identify areas needing infrastructure improvements, such as public transportation and healthcare facilities.
Event Management and Crowd Control
Event organizers estimate crowd sizes and plan logistics, including security and resource allocation, using real-time.
Drone Route Optimization
Drone operators identify high-risk zones and optimal flight times to ensure safer delivery routes, especially in densely populated areas.
Disaster Management and Resource Allocation during emergencies
Emergency responders distribute resources based on population density, ensuring areas with the highest need are prioritized.
Data-Driven Marketing Campaigns
Marketing teams target high population density areas to maximize campaign impact and conversion rates.
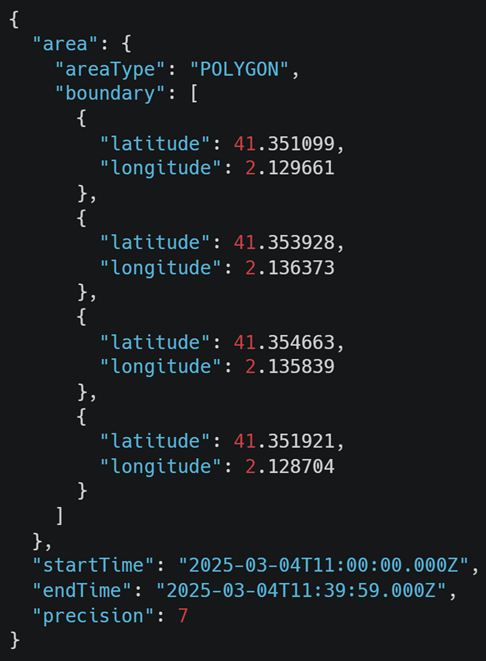
An easy API request to get spatio-temporal data
Discover the API Playground: your interactive environment for testing and exploring Network APIs with ease! Prototype, validate, and experiment in real-time without impacting your live systems.
Get started today and bring your projects to life!
Why choose us

Agility
Easy and fast API integration for quick Go To Market
Reactivity
Delivery of data every 30 minutes

Trust & standards
CNIL / GDPR compliance, CAMARA certified

Reliability
30 to 40% local market share, total population retrieval
Case study
Leveraging data for population density monitoring
Suadeo enables organizations to manage, transform and visualize all kind of data sources at the same place, in an autonomous, secure and efficient way, in order to make strategic decisions in real time.
Used APIs
Partners
Nicolas Vaillier, Product Expertise Suadeo
Population density API integrates seamlessly with insights from social media data streams to reveal what’s happening in the field.

Frequently-Asked Questions
The algorithms used by Flux Vision permanently guarantee irreversible anonymization by deleting all personal data and making it impossible to identify a natural person, as well as to re-identify them directly or indirectly.
These exclusive algorithms, developed by Orange researchers, are the fruit of several years’ research and comply with the recommendations of the French Data Protection Authority (Commission Nationale Informatique et Libertés – CNIL), recognized as one of the most protective bodies in the world, to whom they were presented during the design of Flux Vision and before its launch. In fact, the technical data processed as part of Flux Vision are not considered personal data and are therefore not subject to the GDPR.
Flux Vision is a service designed to provide statistical indicators for analyzing the presence, movements and socio-demographic profiles of people in one or more specific geographical areas. It can be used for a wide range of applications: studying people’s movements, analyzing tourist numbers in a town/region or at a sporting/cultural event, analyzing footfall in a shopping area or determining catchment areas. The solution provides access to innovative, permanently available, guaranteed and secure information on very large sample volumes, without the need to deploy equipment in the field.
Flux Vision has collected a long history of anonymous statistics on the covered territory. By the use of Data Science techniques, predicted density is calculated based on this long history of data and recent trend. Maximum and Minimum values provided as part of API output, are calculated based on observation data from past history.
Observation of data is made at the lowest administrative resolution available (IRIS level for France). Using Flux Vision’s statistical models and considering building density on the observed area, data is distributed at geohash7 level.
Related APIs

Quality on Demand
Gain actionable insights with predictive population density estimations tailored to your specific area and timeframe.